TRI Author: Muratahan Aykol
All Authors: Vinay I Hegde, Muratahan Aykol, Scott Kirklin, Chris Wolverton
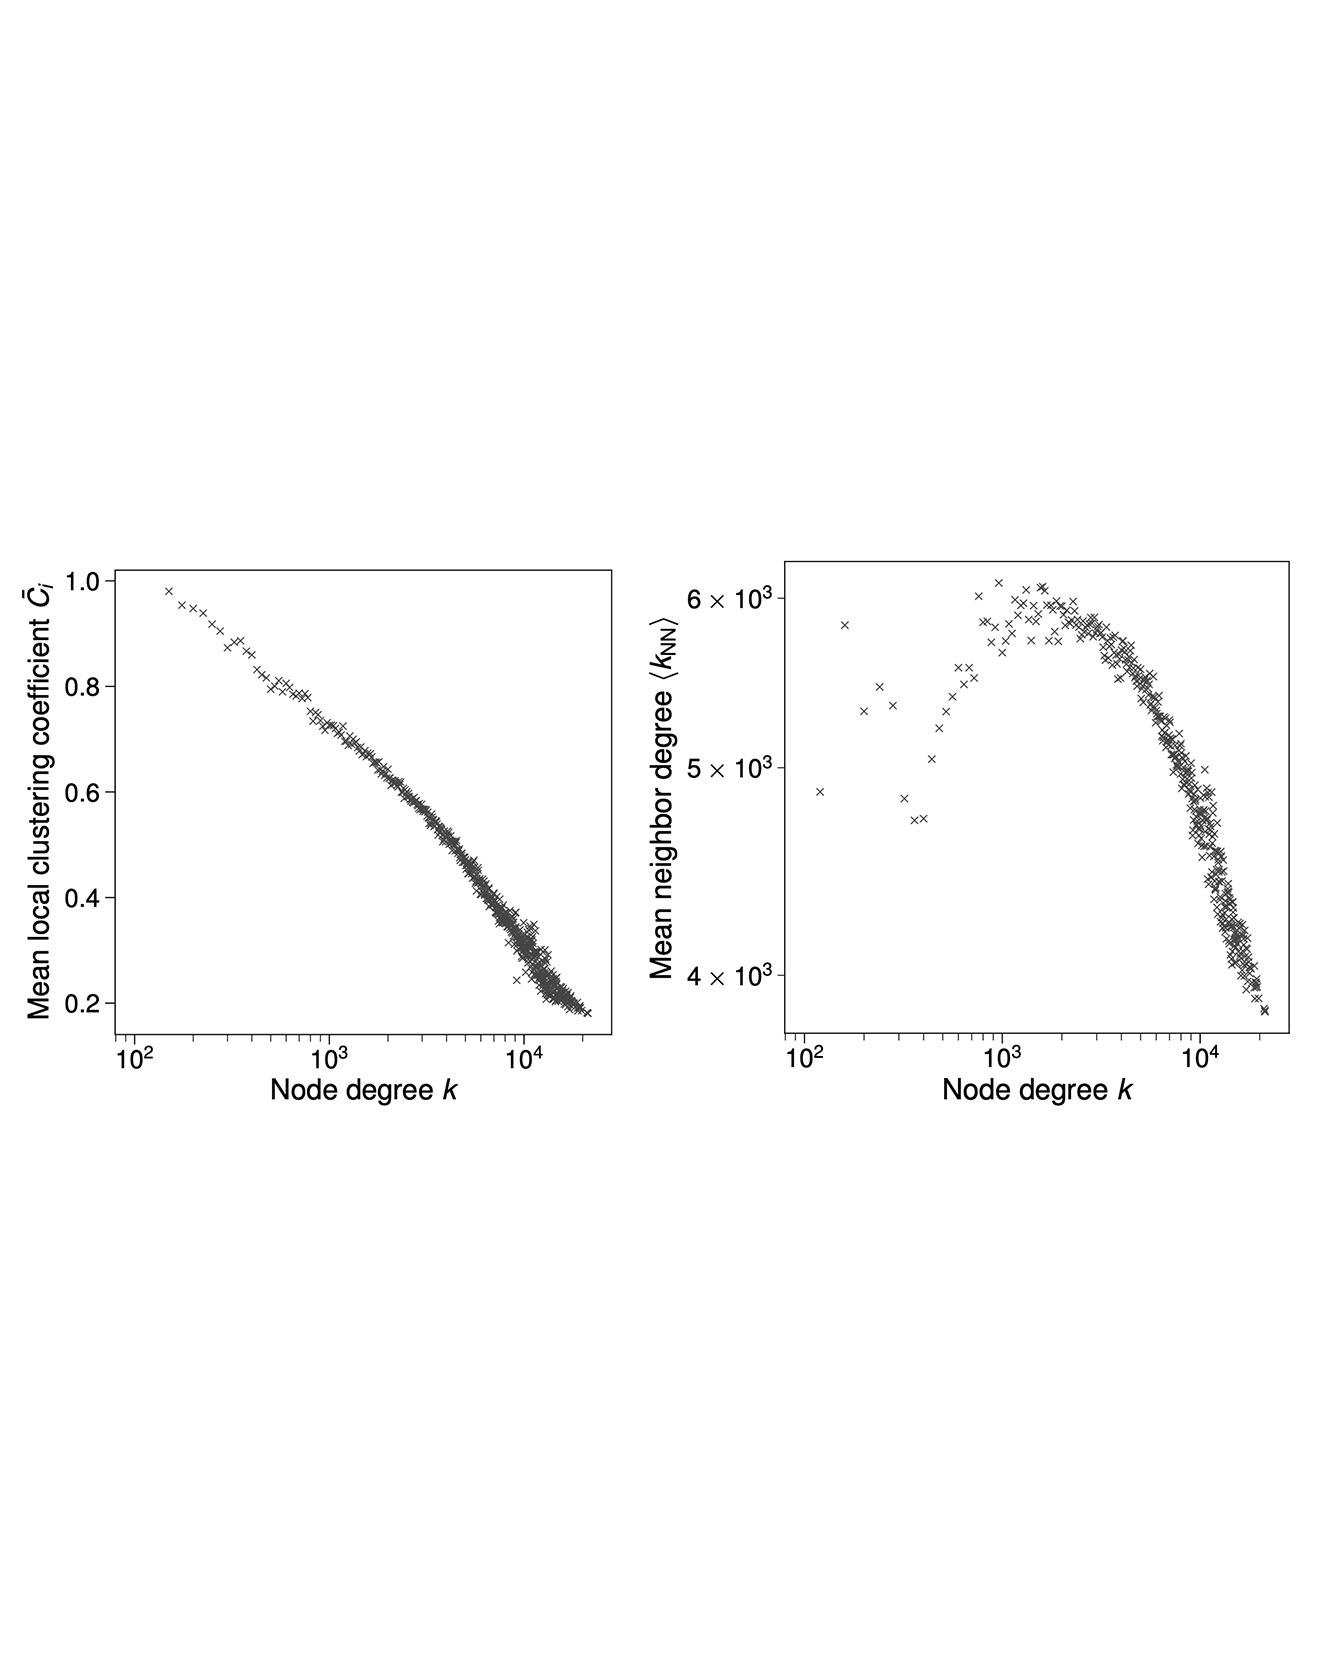
Understanding how the arrangement of atoms and their interactions determine material behavior has been the dominant paradigm in materials science. A complementary approach is studying the organizational structure of networks of materials, defined on the basis of interactions between materials themselves. In this work, we present the "phase diagram of all known inorganic materials", an extremely-dense complex network of nearly 2.1×10⁴ stable inorganic materials (nodes) connected with 41×106 tie-lines (edges) defining their two-phase equilibria, as computed via high-throughput density functional theory. We show that the degree distribution of this network follows a lognormal form, with each material connected to on average 18% of the other materials in the network via tie-lines. Analyzing the structure and topology of this network has potential to uncover new materials knowledge inaccessible from the traditional bottom-up (atoms to materials) approaches. As an example, we derive a data-driven metric for the reactivity of a material as characterized by its connectedness in the network, and quantitatively identify the noblest materials in nature. Read more
Citation: Hegde, Vinay I., Muratahan Aykol, Scott Kirklin, and Chris Wolverton. "The phase diagram of all inorganic materials." In Science Advances, arXiv preprint arXiv:1808.10869 (2018).